
Ground Campaign Project
Overview
Granted unprecedented access to Democratic campaign workers, Ryan D. Enos and Eitan Hersh unveil initial findings of the Ground Campaign Project (GCP), a research endeavor done in conjunction with Obama for America, NGP-VAN, and twenty-five state Democratic parties. The result of the partnership is a longitudinal study in which we interviewed nearly 4,000 campaign staffers, interns, and volunteers during the final six months of the 2012 campaign.
The Obama campaign, as well as thousands of federal and state Democratic campaigns, all use the same web-based technology to manage their mobilization efforts. Namely, they use a web interface provided by the company, NGP-VAN. Workers enter the website to access contact information about voters that is used in canvassing, direct mail, email, and phone campaigns. With the help of our partners, we embedded a survey instrument into the NGP-VAN website for all users associated with the Obama campaign across the country as well as for users associated with hundreds of Senate, House, and local races in twenty-five states. From June 11 to November 6, 2012, when workers looked up voters in their campaign database, they were randomly invited to participate in our study. Interviewing campaign activists every day for nearly six months, we have built a database consisting of nearly 4,000 respondents. We will be using this dataset to answer questions about campaign strategy, political activists, and party politics. Here, we display a few graphs of immediate interest in post-election analysis.
Where was Obama’s Ground Campaign?

Every day, from June 11 to November 6, we interviewed staffers, interns, and volunteers working for the Obama campaign. When campaign workers looked up voter contact information in NGP-VAN – the online tool through which the campaign accesses its voter database – one in 100 workers was invited to take a short questionnaire.
The map on the left shows the number of interviews we conducted by state. The number of interviews reflects the concentration of workers focusing on each state. Darker colors suggest that OFA was dedicating more of its ground campaign to these places. Notice that there was significant campaign activity in heavily Democratic states, like California.
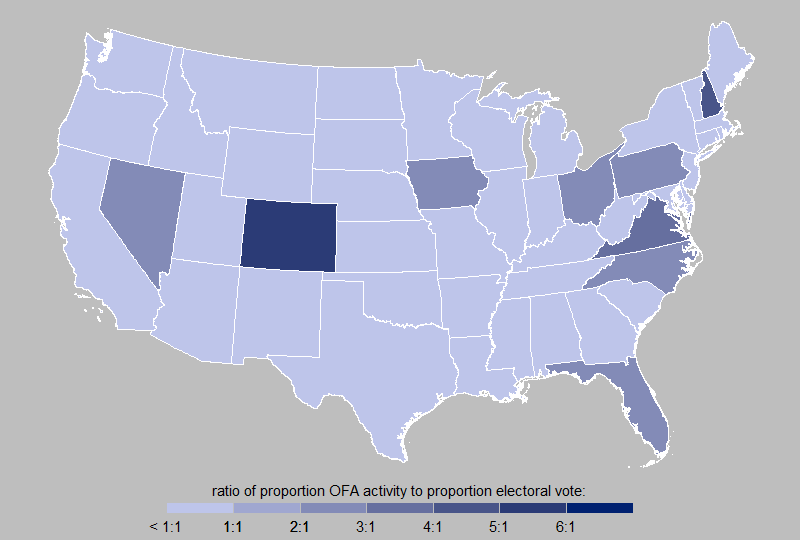
In the map on the right, the number of campaign workers in a state is adjusted by the number of electoral votes in the state. This indicates the Obama campaign’s attention to a state, given the size of the electoral college prize (colors indicate the ratio of the proportion of campaign activity in the state to the proportion of the total electoral college votes in the state). When this adjustment is made, the activity in states like California largely disappears.
The map generally conforms to other measures of Obama’s state-by-state strategy. One lesson we draw, though, is that the campaign took more of an offensive strategy than a defensive one. Even through the end of the campaign season, the campaign very active in Florida and North Carolina, and never engaged many field staff in Michigan and Wisconsin.
Can Campaign Workers Predict Electoral Closeness?
We asked campaign workers to estimate how much Obama would win or lose by in the state in which they were working. Below, we see the result for Florida, where we interviewed over 400 workers in the last six months of the campaign. Plotted along with the campaign workers’ predictions is the RealClearPolitics polling average, aggregated by week. The Obama campaign workers overshot the polls by about 8 points in their estimates. For this reason, we shift the poll trend vertically in order to compare the relative changes across time. We learn both that the campaign workers were always more confident than the polls suggested, and that the campaign workers seemed to sense similar changes in their prospects as indicated by the polls.
